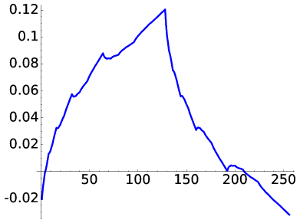
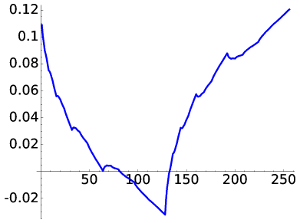
A compactly supported scaling function is a (finite) linear combination of 2-scaled versions of itself. If we consider this linear combination as a functional operator and we iterate it starting with the characteristic function of [-1/2,1/2), we obtain a sequence of functions converging uniformly at exponential rate to the scaling function (under mild regularity conditions). This is the cascade algorithm to approximate scaling functions and wavelets.
It can be proved (see my signal processing course) that the cascade algorithm admits a linear algebra interpretation: We can approximate the scaling functions and the wavelets applying the inverse of the discrete wavelet transform (DWT) to the canonical basis vectors when the dimension is large. As the DWT is a unitary operator (and we focus on the real case) this is like considering the rows of the matrix of DWT.
The length of the filter determines the number of the initial rows corresponding to the scaling function. As we halve the signal each time to separate the details, the critical case is the greatest power of two less than the length of the filter. We consider D4, D6, D8 and D12 and then the ranges are:
| scaling function | wavelet | |
| D4 | 1-2 | 3-N |
| D6 | 1-4 | 5-N |
| D8 | 1-4 | 5-N |
| D12 | 1-8 | 9-N |
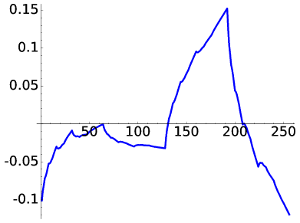
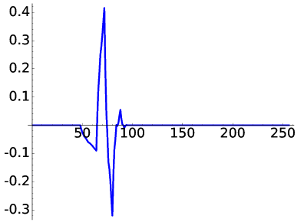
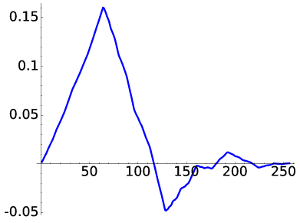
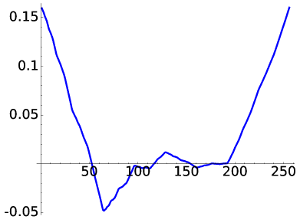
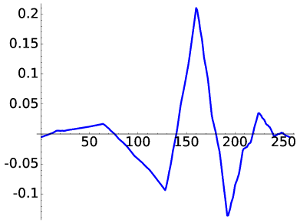
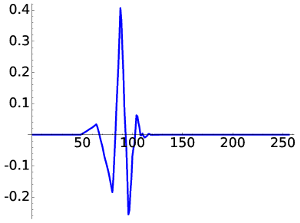
The octave code below applies the cascade algorithm using a function in "The matrix of the DWT" and plotting the results with this sagemath plotter. It produces for N=256 the following figures corresponding to the extremes of the ranges indicated in the table except for changing the upper limit, which would give a quite trivial plot, by 20.
For D4 the scaling function part is
 |
 |
| D4, W1 | D4, W2 |
 |
 |
| D4, W3 | D4, W20 |
For D6 the figures are
 |
 |
| D6, W1 | D6, W4 |
 |
 |
| D6, W5 | D6, W20 |
For D8 we obtain something smoother but still with a little awkward behavior.
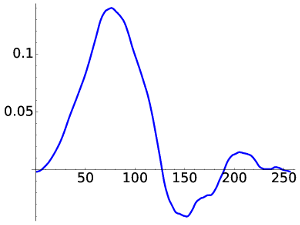 |
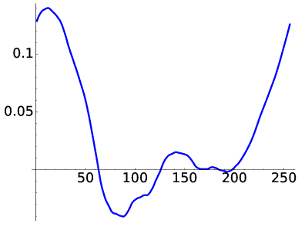 |
| D8, W1 | D8, W4 |
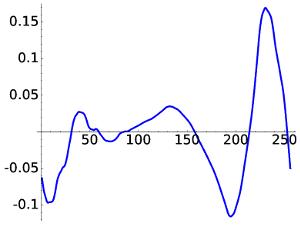 |
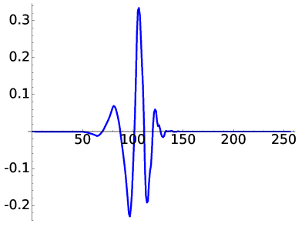 |
| D8, W5 | D8, W20 |
Finally for D12 the aspect is much more regular. Although there is a strange quick change in the curvature, it can be proved that in the limit the functions belong to C2.
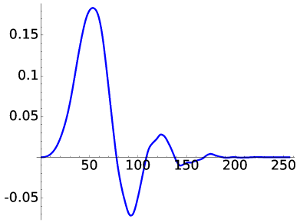 |
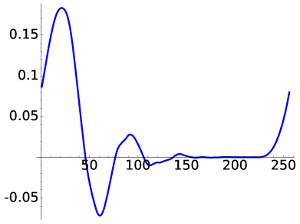 |
| D12, W1 | D12, W8 |
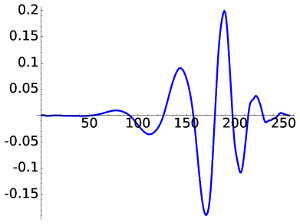 |
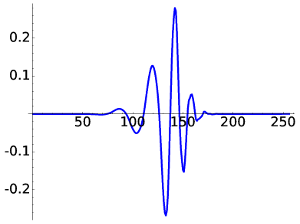 |
| D12, W9 | D12, W20 |
This is the octave code that produces all the images. Note that there is a call to a function in "The matrix of the DWT" and this code generates a text data file to be plotted with this sagemath plotter.
pkg load signal


clear all

%close all


filename = "data_plot.txt";

fid = fopen (filename, "w");


% Haar

haar = [1,-1]/sqrt(2);


% D4

fd4 = [ 1-sqrt(3), sqrt(3)-3, 3+sqrt(3), -1-sqrt(3)]/4/sqrt(2);


% D12 (the bizarre ordering compensated by fliplr is to copy the data from https://en.wikipedia.org/wiki/Daubechies_wavelet )

% D6

fd6 = [0.47046721, 1.14111692 , 0.650365, -0.19093442, -0.12083221, 0.0498175 ];

fd6 = -fliplr(fd6)/sqrt(2).*(-1).^[1:size(fd6,2)];


% D8

fd8 = [0.32580343 , 1.01094572 , 0.89220014, -0.03957503 , -0.26450717 , 0.0436163 , 0.0465036, -0.01498699];

fd8 = -fliplr(fd8)/sqrt(2).*(-1).^[1:size(fd8,2)];


% D12

fd12 = [0.15774243 , 0.69950381 ,1.06226376 , 0.44583132, -0.31998660, -0.18351806 , 0.13788809 , 0.03892321 , -0.04466375 , 7.83251152e-4, 6.75606236e-3, -1.52353381e-3 ];

fd12 = -fliplr(fd12)/sqrt(2).*(-1).^[1:size(fd12,2)];


% MATRIX OF THE TRANSFORMS

N = 256


W = wav_tr( fd4, eye(N));

for r = [1,2,3,20]

  fprintf (fid, '(%f, %f)\n', [1:N; W(r,1:N)]);

  fprintf (fid, sprintf('>!_!_!_\nPJ1 TH3 FI./cas_d4_%d.eps\n!_!_!_<\n',r));

end


W = wav_tr( fd6, eye(N));

for r = [1,4,5,20]

  fprintf (fid, '(%f, %f)\n', [1:N; W(r,1:N)]);

  fprintf (fid, sprintf('>!_!_!_\nPJ1 TH3 FI./cas_d6_%d.eps\n!_!_!_<\n',r));

end


W = wav_tr( fd8, eye(N));

for r = [1,4,5,20]

  fprintf (fid, '(%f, %f)\n', [1:N; W(r,1:N)]);

  fprintf (fid, sprintf('>!_!_!_\nPJ1 TH3 FI./cas_d8_%d.eps\n!_!_!_<\n',r));

end


W = wav_tr( fd12, eye(N));

for r = [1,8,9,20]

  fprintf (fid, '(%f, %f)\n', [1:N; W(r,1:N)]);

  fprintf (fid, sprintf('>!_!_!_\nPJ1 TH3 FI./cas_d12_%d.eps\n!_!_!_<\n',r));

end


fclose (fid);