A sagemath plotter


To my taste the figure output when 2D plotting in Matlab/Octave is not very appealing. Besides in my experience the conversion of figures into files sometimes is not good, an .eps of a simple plot may be very heavy. I prefer to use sagemath if possible.
The code below provides a primitive but effective way of plotting results generated by Matlab/Octave and stored in a text file named data_plot.txt. Essentially one has to print the coordinates x and y and a final line with metadata indicating the filename of the figure and the format. If the filename is not included it is assumed that the figure must be held and merged with the following figures until a filename is provided.
The instruction are included in the code. Here I only expand the examples. The procedure is to run first the Matlab/Octave and later this code to produce the figure.

simple_plot_1
% matlab/octave code

filename = "data_plot.txt";
fid = fopen (filename, "w");

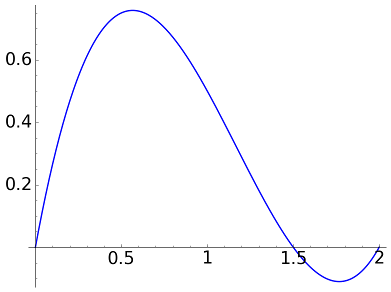
t = (0:0.01:2); % row vector
fprintf (fid, '(%f, %f)\n', [t; t.*(t-3/2).*(t-2) ]);
fprintf (fid, '>!_!_!_\nPJ1 TH2 FI./simple_plot_1.png\n!_!_!_<\n');

fclose (fid);


Plotting y=x(x-3/2)(x-2) joining points and with thickness 2


simple_plot_2
filename = "data_plot.txt";
fid = fopen (filename, "w");

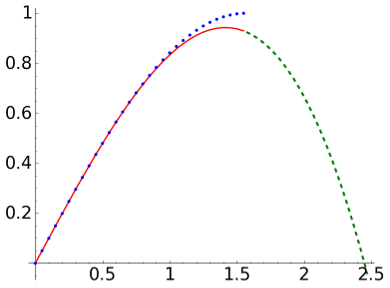
t = 0:0.05:pi/2;
fprintf (fid, '(%f, %f)\n', [t; t-t.^3/6]);
fprintf (fid, '>!_!_!_\nPJ1 TH2 COred ZO10\n!_!_!_<\n');
fprintf (fid, '(%f, %f)\n', [t; sin(t)]);
fprintf (fid, '>!_!_!_\nPJ0 SI20 ZO20\n!_!_!_<\n');
t = pi/2:0.05:2.5;
fprintf (fid, '(%f, %f)\n', [t; t-t.^3/6]);
fprintf (fid, '>!_!_!_\nPJ1 TH3 COgreen LS-- FI./simple_plot_2.png\n!_!_!_<\n');


fclose (fid);


Plotting the approximation of y=sinx by y=x-x3/6


The code

This is the SAGE code of the plotter:

# Plot the data indicated in data_plot
# begseparator, metadata, endseparator
# begseparator = '>!_!_!_\n'
# metadata = any string ended with \n
# endseparator = '!_!_!_<\n'

# If FI = '' then merge with the following plot


#keys metadata: PJ (plotjoined), TH (thickness), SI (size), FI (file), AX (axes), FS (fontsize), CO (color), ZO (zorder), LS (linestyle)

# Example of call in octave:
# t = (0:0.01:2); % row vector
# fprintf (fid, '(%f, %f)\n', [t; t.*(t-3/2).*(t-2) ]);
# fprintf (fid, '>!_!_!_\nPJ1 TH2 FI./borri.eps\n!_!_!_<\n');

# A more complicate example involving two graphs:
# t = 0:0.1:pi;
# fprintf (fid, '(%f, %f)\n', [t; t-t.^3/6]);
# fprintf (fid, '>!_!_!_\nPJ1 TH2 COred ZO10\n!_!_!_<\n');
# fprintf (fid, '(%f, %f)\n', [t; sin(t)]);
# fprintf (fid, '>!_!_!_\nPJ1 TH2 ZO20 FI./borri.eps\n!_!_!_<\n');


def pplot( text, Q ):
   Temp = text.split('>!_!_!_')
   L = (Temp[0].strip()).split('\n')
   for k in range( len(L) ):
      L[k] = sage_eval( L[k] )
   
   
   metad = Temp[1].strip()   
   
   # default
   PJ = True    # plotjoined
   TH = 1       # thickness
   SI = 30      # size
   FI = ''      # file
   AX = 'True'   # axes
   FS = 25      # fontsize
   CO = 'blue'   # color
   ZO = 0      # zorder
   LS = '-'   # linestyle
   
#   print metad
   Lm = metad.split(' ')
   for item in Lm:
      temp = item.strip()
      
      prefix = temp[0:2]
      rest = temp[2:]
      if prefix == 'PJ':
         if rest == '0': PJ = False         
      if prefix == 'TH':
         TH = sage_eval( rest )
      if prefix == 'SI':
         SI = sage_eval( rest )
      if prefix == 'FI':
         FI = rest
      if prefix == 'AX':
         if rest == '0': AX = False         
      if prefix == 'FS':
         FS = sage_eval( rest )
      if prefix == 'CO':
         CO = rest
      if prefix == 'ZO':
         ZO = sage_eval( rest )
      if prefix == 'LS':
         LS = rest
         
      
#   print 'PJ', PJ
#   print 'TH', TH
#   print 'SI', SI
#   print 'FI', FI
#   print 'AX', AX
#   print 'FS', FS
   
   
   if PJ:
      P = list_plot(L, plotjoined= PJ, thickness = TH, color = CO, linestyle = LS)
   else:
      P = list_plot(L, plotjoined= PJ, size = SI, color = CO)
   
   if ZO != 0: P[0].set_zorder( ZO )
   
   if Q!='':
      P = P + Q
   
   P.fontsize( FS )
   #P.set_aspect_ratio(1)
   P.axes( AX )
   
   #merge
   if FI == '': return P
   
   P.save( FI )
   return ''


with open('./data_plot.txt', 'r') as f:
   text = f.read()
   text = text.strip()
   
   Ltemp = text.split('!_!_!_<')[:-1]
   
   Q = ''
   for item in Ltemp:
      Q = pplot( item, Q )