COURSE TITLE
BASIC STATISTICS AND PROBABILITY
6 ECTS credits (4 Boston U. credits)
Prerequisites
Good background in High School Algebra
Minimum attendance requirement
Attendance is compulsory. All exams are required. Make up exams will be given only under very special circumstances.
Instructor
Prof. Patricio Cifuentes
Department: Matemáticas
Building/office: Ciencias / Módulo 17, room 404
Email: patricio.cifuentes@uam.es
Web pages: http://www.uam.es/patricio.cifuentes
Office hours: M, 12:30 to 14:30; Th, 11:30 to 12:30.
Course objectives
The main aim of this course is to introduce the student to the basic statistical concepts that will permit a first approach to the descriptive and the inferential statistical tools, giving enough background to interpret the basic Statistics results found in scientific papers. The course is completed with a short introduction to the elementary concepts in Probability, essential to give a scientific foundation to Mathematical Statistics. These general objectives may be summarized in the following four points:
Introduction to the basic Statistical tools to analyze data proceeding from a variety of sources.
Introduction to the basics of Probability.
Ability to read and understand statistical texts from several scientific areas.
Use of basic computing statistical tools.
Course contents
DESCRIPTIVE STATISTICS: Graphical and numerical representation of quantitative data. Paired data: correlation coefficient.
PROBABILITY MODELS AND SAMPLING: Discrete random variables. Bernoulli trials. Binomial distribution. Continuous random variables. Uniform distribution. Normal distribution. Sampling. Estimators. Distributions related to the normal distribution: Chi square, Student's t, F.
-
POINT ESTIMATION: The concept of a point estimator. Properties. Criteria to determine good point estimators.
-
CONFIDENCE INTERVALS: Constructing confidence intervals. Confidence intervals for proportions. Confidence intervals for means in normal populations. Paired data. Approximate intervals from large samples. Minimum sample size.
-
HYPOTHESIS TESTING: Setting of the problem. Null and alternative hypothesis. Type I and Type errors. Significance level and rejection set. Tests for ratios. Tests for mean in normal populations. Paired data. Relationship between confidence intervals and hypothesis testing. What is the p-value? Non-parametric tests: goodness of fit.
References
Textbook
-
MCCLAVE, JAMES T. and SINCICH, TERRY;
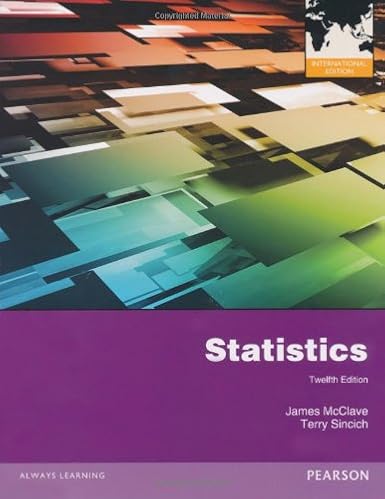
Statistics
(12th international ed.) Pearson Education International. ISBN 13: 978-0-321-80728-1.

- MCCLAVE, JAMES T. and SINCICH, TERRY; Statistics (11th ed.) Pearson. ISBN-13: 978-0-13-206951-9.
Other texts
- MOORE, DAVID S. The Basic Practice of Statistics. W. H. Freeman, (several editions).
- MILTON, J. SUSAN and ARNOLD, JESSE C. Introduction to Probability & Statistics. McGraw-Hill, (several editions).
Teaching methodology
The course will meet 4 hours per week. The material of the course will be covered during two of these four hours. The other two hours will be dedicated to discussing and solving exercises, using specialized computer software, and doing exams and quizes. You will need to bring to class a calculator.
A list of homework exercises is given below. It is important to work out these exercises. They cover the essential parts of the course. You will be asked to turn in only some of the exercises. Homework can be worked out in groups but should be turned in individually.
This subject web page, where all the information on this page is mantained, is
http://www.uam.es/patricio.cifuentes/BS&P/index.html
The course material will be kept and updated at
https://moodle.uam.es/
where only registered students will bew able to access.
Student workload
Students are supposed to dedicate 6 hours per week to personal study and work.
Evaluation procedures
During the semester, two quizzes and a midterm will be given. The final grade will be determined as follows: the final exam will count 40%, the midterm will count 30%, each quiz will count 15%.
Course calendar
Week 1: Sep 9th. Intro; overview; Statistics, what is it? Types of data.
Week 2: Sep 16th. Data description, summaries. Diagrams, plots, numbers
Week 3: Sep 23rd. Intro to Probability, elementary problems.
Week 4: Sep 30th. Quiz 1. A more formal approach to probability.
Week 5: Oct 7th. Random variables. Discrete random variables.
Week 6: Oct 14th. Bernoulli trials, binomial distribution.
Week 7: Oct 21st. Continuous random variables. Uniform and normal distributions.
Week 8: Oct 28th. Review sessions. On Thursday, Oct 30th: Midterm.
Week 9: Nov 4th. Sampling and the Central Limit Theorem.
Week 10: Nov 11th. Point and interval estimation. Means and Proportions.
Week 11: Nov 18th. Hypothesis testing. Hypothesis testing for the mean, known variance.
Week 12: Nov 25th. Quiz 2. Hypothesis testing for mean and variance.
Week 13: Dec 2nd. [ Organic Chemistry Lab ]
Week 14: Dec 9th. Two-sample inferences, equal variances.
Week 15: Dec 17th, Wednesday. Final exam.
Class slides
Available in MoodleClass exercises
Available in MoodleSPSS practice
List of Homework Exercises
Exercises from: MCCLAVE, JAMES T. and SINCICH, TERRY; StatisticsColor key: 11th ed.; 12th ed.;
Chapter 1:
13 18 23 26 32
13 18 23 26 32
Chapter 2:
7  9 25 52 53 55 66 76 90 103 106 123 125
9 11 27 54 55 57 68 78 94 109 111 129 131
Chapter 3:
10 14 15 20 27 41 45 49 53 63 67 79 80  98 101 104 115 132 135
10 14 15 20 29 43 47 53 57 67 71 85 86 102 105 110 123 142 145
Chapter 4:
7 8 15 16 19 21 38 41 53 56 60
7 9 17 18 21 23 40 43 55 58 64
Chapter 5:
3 4  9 24 28 43 58 63 73 77
3 4 11 26 28 47 60 65 75 81
Chapter 6:
3 8 14 16 27 28 30 37
3 8 14 15 27 28 30 37
Chapter 7:
7 9 11 13 27 28 29 35 47 53 70 74 75
7 9 11 13 29 30 31 39 51 59 76 82 83
Chapter 8:
 8 15 23 24 27 31 38 42 49 59 60 66 76 78 81 108 109
12 17 23 24 30 33 40 44 51 63 62 68 80 82 85 114 115
Chapter 9:
4 6 9 14 19 33 35 41 53 59 62 76
4 6 9 16 19 33 35 41 54 59 62 76