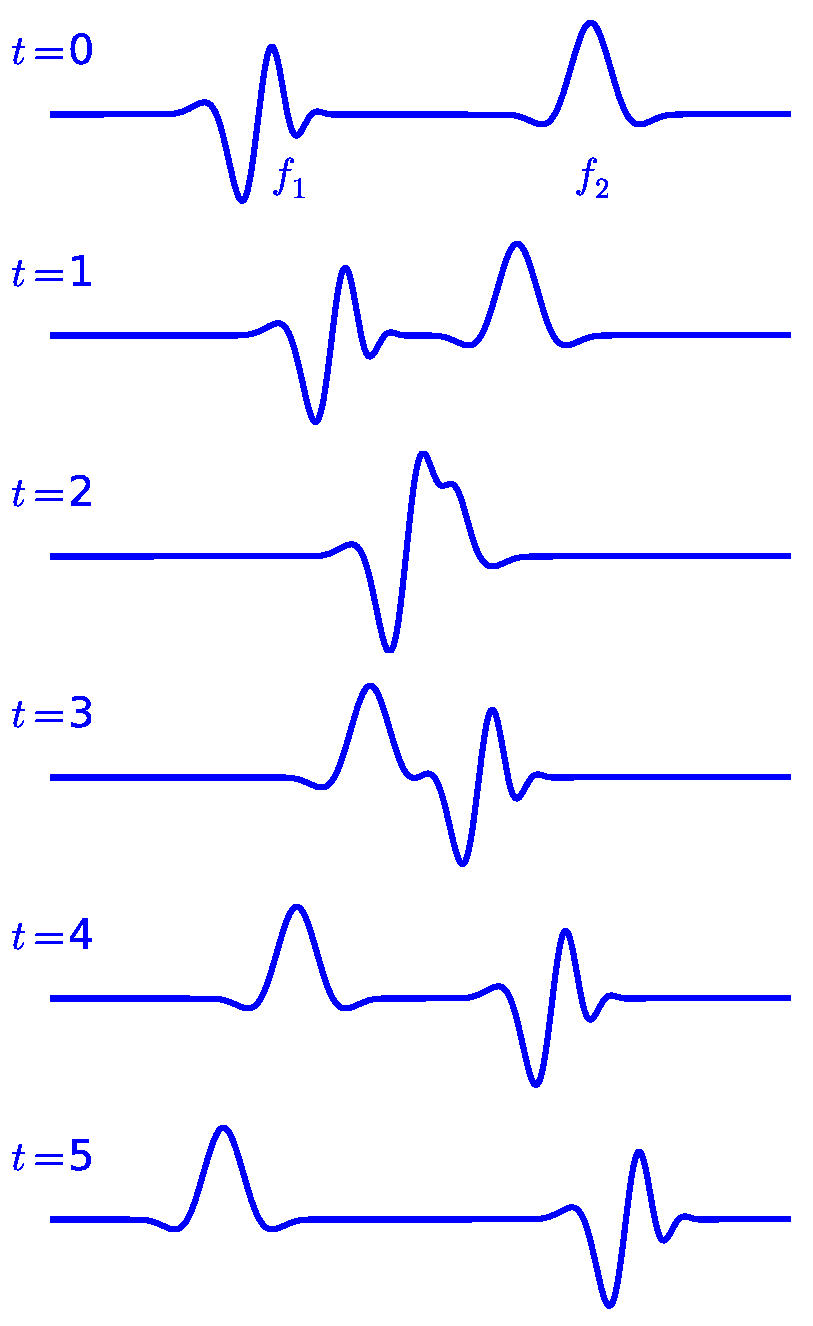
This is the SAGE code that produces the images:
h = 0.5

off = -3.7

def ir_ha(x):

    if x<0: x = -x

    if x>2: return 0

    if x>1: return (2-x)^3/4

    return (3*x^3-6*x^2+4)/4


def f1(x):

    x /= h

    x -= off

    return ir_ha(x)*sin(x^2+4*x-0.7)


def f2(x):

    x /= h

    x += off

    return ir_ha(x)*cos(2.0*x)


def u(x,t):

    return f1(x-t)+f2(x+t)


k = 0

for t in srange(0,4.6,0.8):

    def w0(x):

        return u(x,t)

    P = plot( w0, x,-4, 4, thickness=4, ymin=-1, ymax=1.1)

    if k==0:

        P += text('$f_1$',(off+2.3,-0.7), fontsize=30 )

        P += text('$f_2$',(-off-1.8,-0.7), fontsize=30 )

    P += text('$t=$'+str(k),(-4,0.7), fontsize=30 )

    P.fontsize(25)

    P.set_aspect_ratio(1)

    P.axes(False)

    P.save('../images/1dwav'+str(k)+'.eps')

    k += 1