Time interval [0.01, 0.02]
This is an exercise taken from my signal processing course.
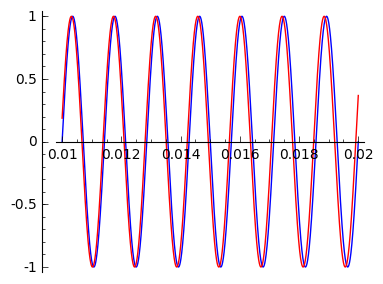
The audio file interference.mp3 corresponds to the superposition of two sine waves of frequencies 700Hz and 703Hz. The challenge is to explain the funny sound and find a formula for the time lapse in seconds between two consecutive pulses in terms of the frequencies of the two waves.
In case it helps, here there are some plots of both waves in three intervals of width one hundredth of second.
|
Time interval [0.01, 0.02] |
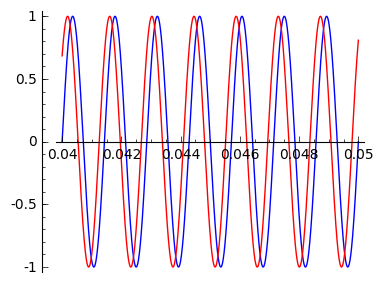 |
Time interval [0.04, 0.05] |
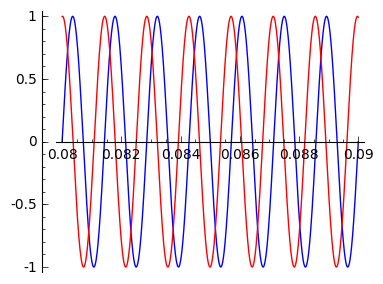 |
Time interval [0.08, 0.09] |
This is the SAGE code generating the images:
def plotfg(a,w):

  f = sin(2*pi*700*x)

  g = sin(2*pi*703*x)


  P = plot(f,x,a,a+w, color='blue')

  P += plot(g,x,a,a+w, color='red')

  print 'interval = [',a,',',a+w,']'

  return P


plotfg(0.01, 0.01).save('st_be1.png', figsize =4)

plotfg(0.04, 0.01).save('st_be4.png', figsize =4)

plotfg(0.08, 0.01).save('st_be8.png', figsize =4)