|
#######################
#### RUNGE
#######################
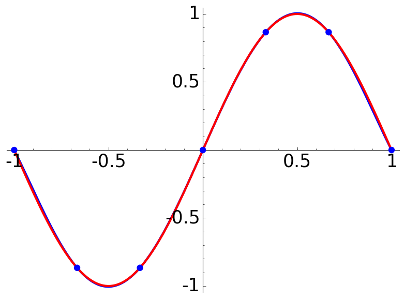
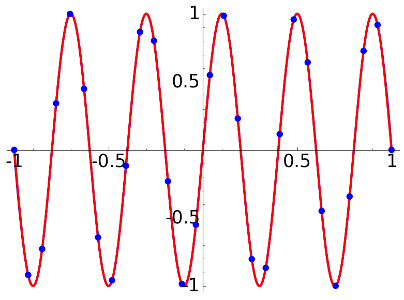
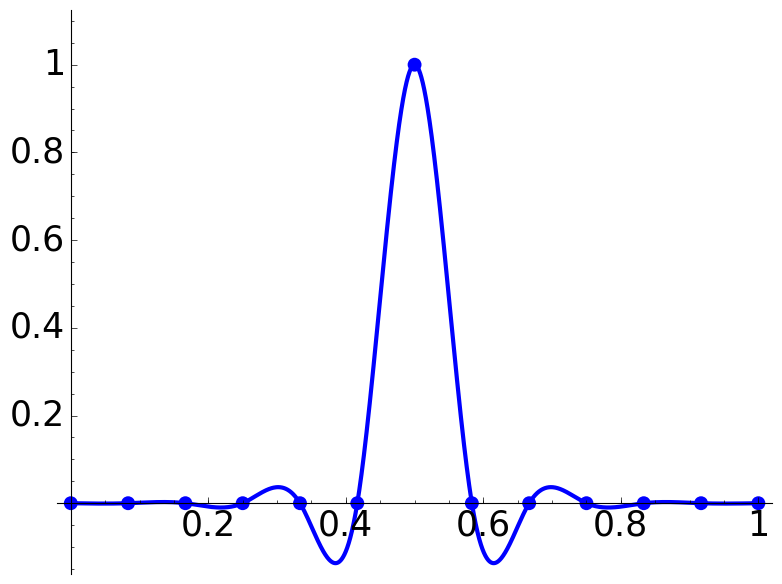
def rung(N):
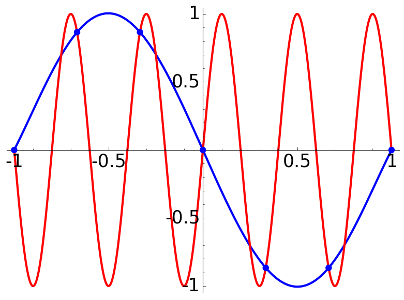
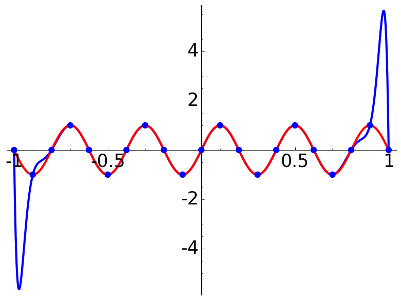
#f = sin(5*pi*x)
#f = sin(pi*x)
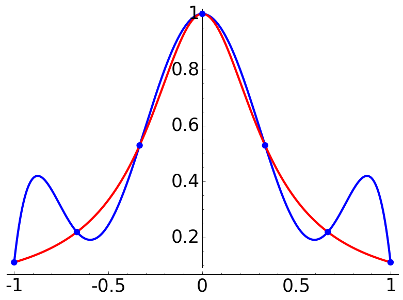
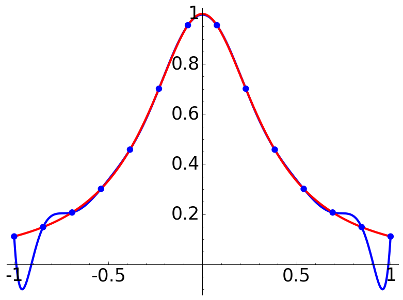
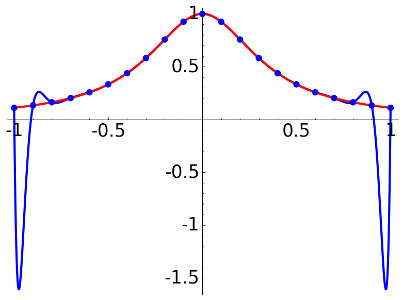
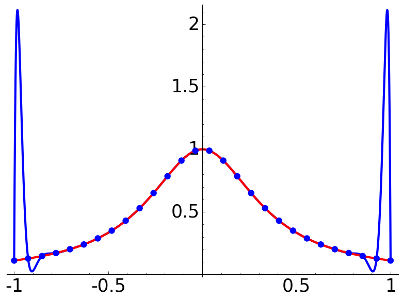
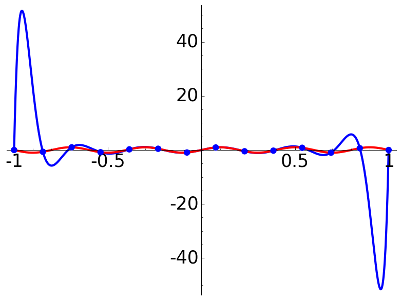
    #f = 1/(8*x^2+1)

    h = 2/(N-1)

    xs = srange(-1,1+h/2,h)

    ys = [ f(x=xx).n() for xx in xs]


    p_i = prod(x-ii for ii in xs);

    pid = diff(p_i,x);

    g = sum(p_i/(x-ii)/pid(x=ii)*jj for (ii,jj) in zip(xs,ys))


    P = plot(g,x,-1, 1, thickness=3)

    P += plot(f,x,-1, 1, color='red', thickness=3)

    P += list_plot(zip(xs,ys), size=80, zorder=200)


    #P.set_aspect_ratio(1)

    #P.axes(False)

    P.fontsize(25)

    return P


P = rung(20)


P.show()
|