|
def mgraphe(a):
lb = -10
ub = -lb
L = []
for xx in srange(0,1+1/100,1/100):
S = 0.0
for k in
srange(lb,ub+1):
v = ( exp(-a^(2*k+2*xx)) -
exp(-a^(2*k+2*xx-1)) ).n(digits=16)
S += v
L.append( (xx,S)
)
P = list_plot(L, plotjoined=True)
P += point([(0,0)], size=0)
return P
def mgraph(a):
lb = -40
ub = -lb
L = []
for xx in srange(0,1+1/100,1/100):
S = 0.5
for k in
srange(lb,ub+1):
v = ( exp(-a^(2*k+2*xx)) -
exp(-a^(2*k+2*xx-1)) ).n(digits=70)
S += v
L.append( (xx,S)
)
c1 = ( exp(-a^(2*lb+2*0)) -
exp(-a^(2*lb+2*0-1)) ).n(digits=70)
c2 = ( exp(-a^(2*ub+2*0)) -
exp(-a^(2*ub+2*0-1)) ).n(digits=70)
c3 = ( max( item[1] for item in L
)- min( item[1] for item in L )
).n(digits=70)
if c3 < 100*max(-c1,-c2): print
'DANGER'
print '----------------'
P = list_plot(L,
plotjoined=True, ticks=[0.2, c3/10])
return P
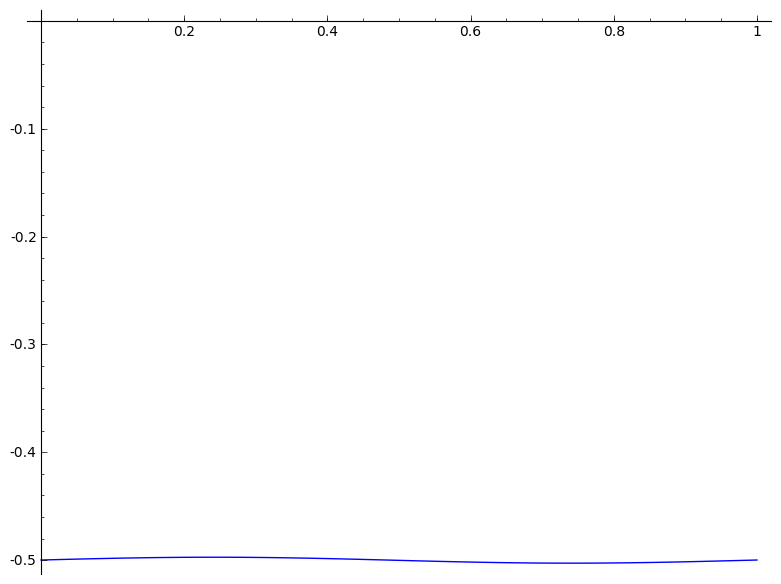
P = mgraphe(4)
P.save('noncoe4.png')
P = mgraphe(3)
P.save('noncoe3.png')
P = mgraphe(2)
P.save('noncoe2.png')
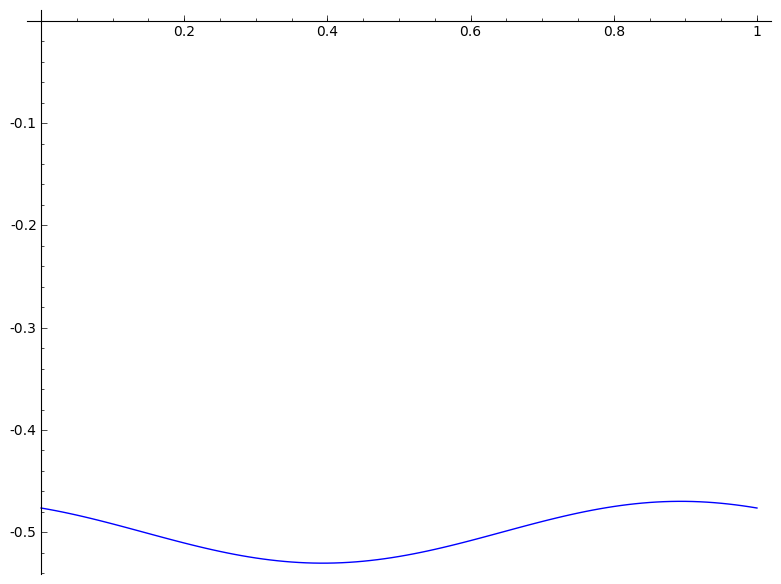
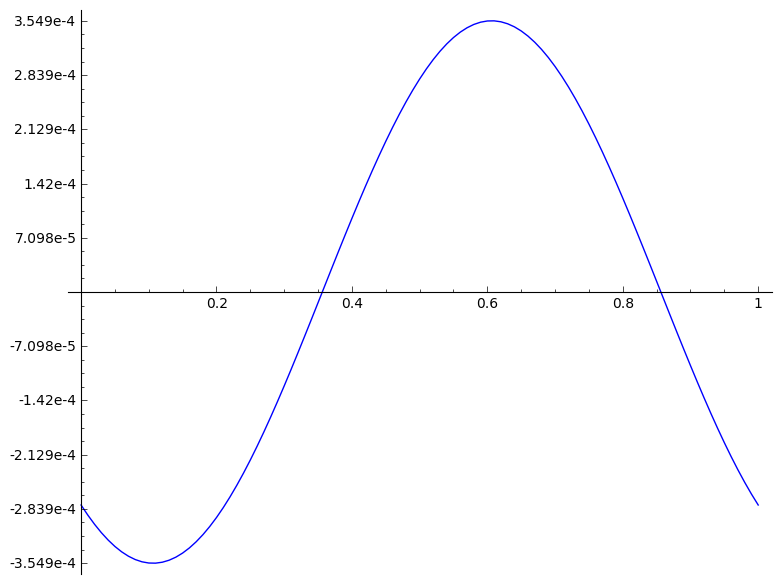
P = mgraph(1.3)
P.save('nonco1p3.png')
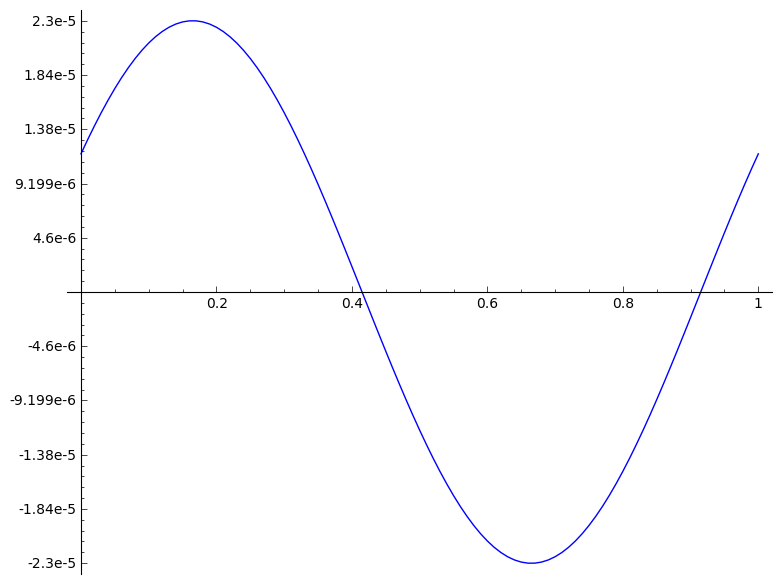
P = mgraph(1.5)
P.save('nonco1p5.png')
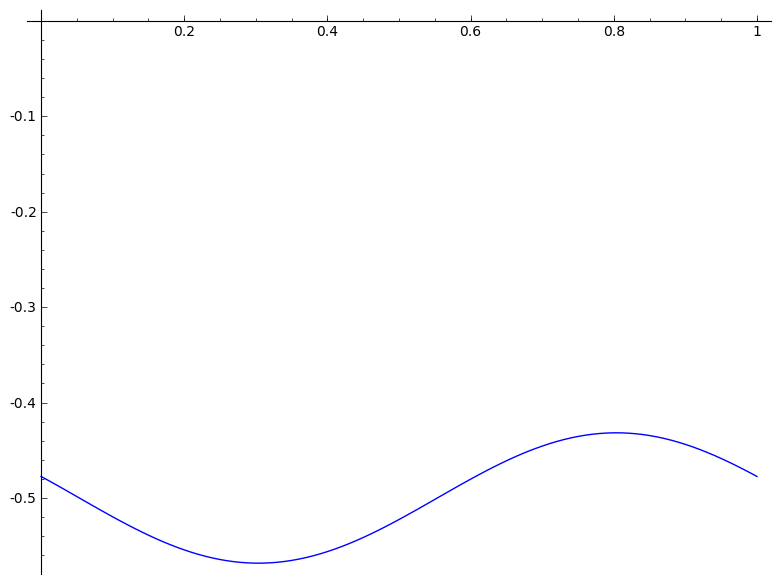
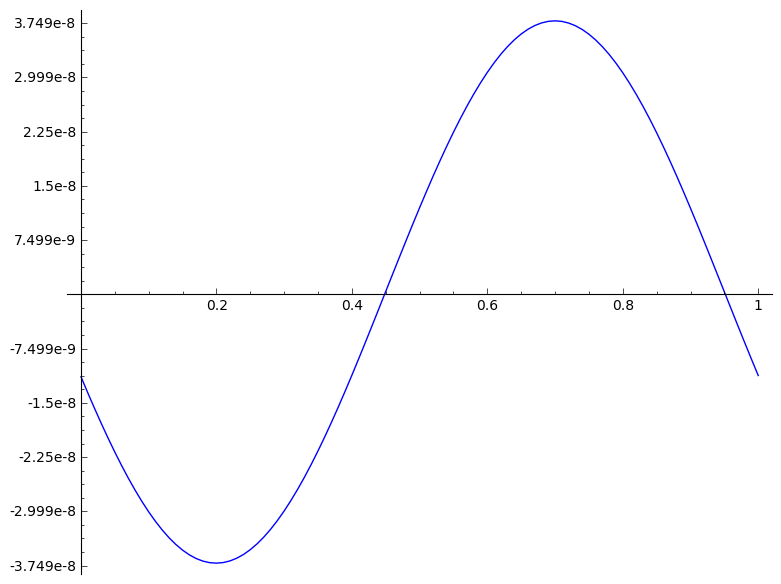
P = mgraph(1.7)
P.save('nonco1p7.png')
P = mgraph(1.9)
P.save('nonco1p9.png')
|