The Lloyd-Max algorithm

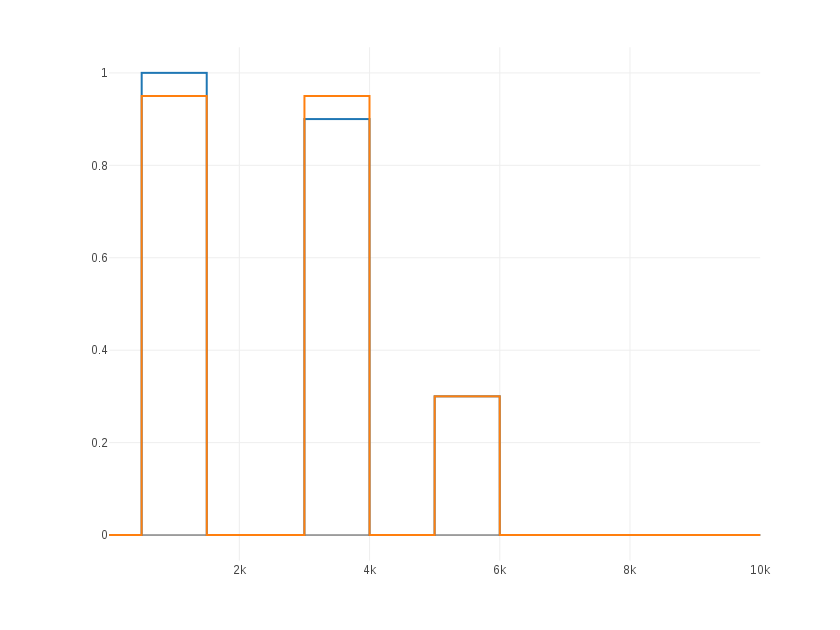
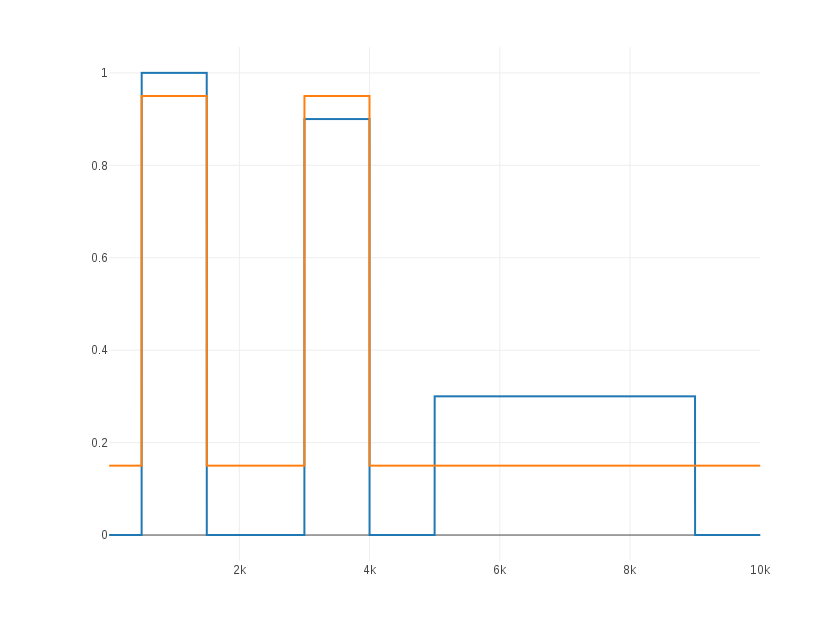
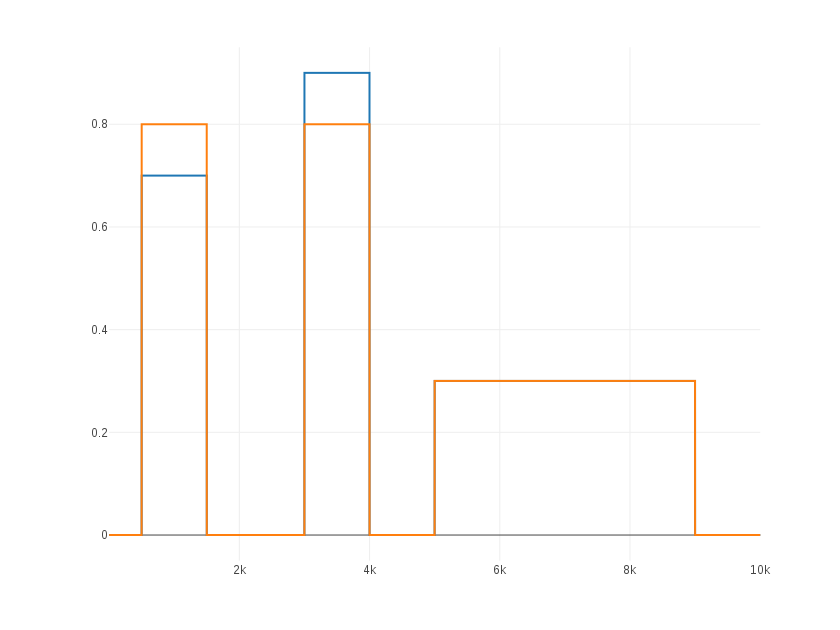
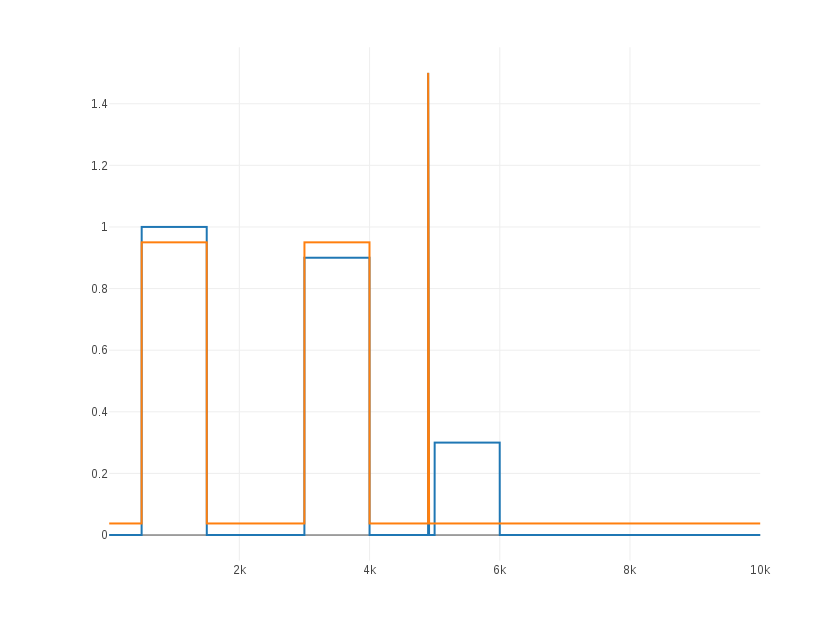
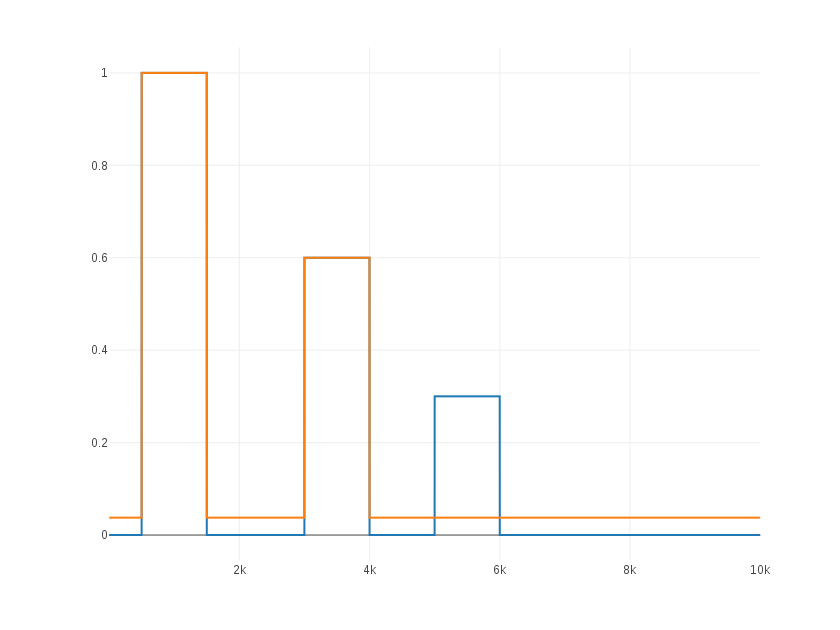
Here we do some experiments applying Lloyd-Max algorithm to a large set of data and imposing three levels of quantization. The blue line is the signal and the height of the horizontal steps of the orange line shows the representation points (the images of the quantizer). The code is included below. The marked part is modified accordingly in each case. MSE is the abbreviation of Mean Squared Error.


lloyd1
Although the value 0 has a greater probability, the distance between the high blocks is too large to choose a medium quantization level without increasing the MSE.
%%%%%%%%%%%%%%%%%%%
y(500:500+M-1) = ones(M,1);
y(3000:3000+M-1) = 0.6*ones(M,1);
y(5000:5000+M-1) = 0.3*ones(M,1);
%%%%%%%%%%%%%%%%%%%%%%%%%%%%%%%%%%%


lloyd2
Here the higher blocks are closer and then it is more economical in terms of the MSE to choose a medium quantization level for both at spend the other two with the values 0 and 0.3.
%%%%%%%%%%%%%%%%%%%
y(500:500+M-1) = ones(M,1);
y(3000:3000+M-1) = 0.9*ones(M,1);
y(5000:5000+M-1) = 0.3*ones(M,1);
%%%%%%%%%%%%%%%%%%%%%%%%%%%%%%%%%%%


lloyd3
Strange performance of the algorithm. In this case it takes only 2 levels of quantization leaving one unused. We observe a similar behavior if the second block is below 0.5.
%%%%%%%%%%%%%%%%%%%
y(500:500+M-1) = ones(M,1);
y(3000:3000+M-1) = 0.9*ones(M,1);
y(5000:5000+4*M-1) = 0.3*ones(4*M,1);
%%%%%%%%%%%%%%%%%%%%%%%%%%%%%%%%%%%


lloyd4
Separating the heights of the two first block we recover the expected situation.
%%%%%%%%%%%%%%%%%%%
y(500:500+M-1) = 0.7*ones(M,1);
y(3000:3000+M-1) = 0.9*ones(M,1);
y(5000:5000+4*M-1) = 0.3*ones(4*M,1);
%%%%%%%%%%%%%%%%%%%%%%%%%%%%%%%%%%%


lloyd5
Again a strange behavior. A so thin peak, just 3 values out of 10000, should not contribute significantly to the MSE.
%%%%%%%%%%%%%%%%%%%
y(500:500+M-1) = ones(M,1);
y(3000:3000+M-1) = 0.9*ones(M,1);
y(5000:5000+M-1) = 0.3*ones(M,1);
y(4900:4902) = 1.5;
%%%%%%%%%%%%%%%%%%%%%%%%%%%%%%%%%%%


The code

The plots were done with the following Matlab code.

N = 3; % quantization levels

fprintf('quant. levels = %d\n',N);
Ns = 10000;

y = zeros(Ns,1);
t = 1:Ns;
M = 1000;
%%%%%%%%%%%%%%%%%%%%%%%%%%%%%%%%%%%
%% MODIFY THIS PART
%%%%%%%%%%%%%%%%%%%
y(500:500+M-1) = ones(M,1);
y(3000:3000+M-1) = 0.6*ones(M,1);
y(5000:5000+M-1) = 0.3*ones(M,1);
%%%%%%%%%%%%%%%%%%%%%%%%%%%%%%%%%%%

[partition,codebook] = lloyds(y,N);
[indx,quant,distor] = quantiz(y,partition,codebook);
figure(1)
plot(t,y,t,quant,'--');
maxquant = max(quant);
minquant = min(quant);

codebook
fprintf('max level = %d\n',maxquant);
fprintf('min level = %d\n',minquant);