Gaussian Farey fractions

The figures in this document are produced with the sagemath code below. Full resolution versions are obtained clicking on the images.

The natural generalization of the Farey fractions for the Gaussian integers is \[\mathcal{G}_N = \Big\{ \frac{z_1}{z_2}\,:\, z_1,z_2\in\mathbb{Z}[i]\text{ coprime and } |z_2|^2< N \Big\}\cap\big\{\Re(z),\Im(z)\in [0,1]\big\}.\]

As in the standard case, the distance of two fractions \(A/Q,\,A'/Q'\in\mathcal{G}_N\) is at least \(|QQ'|^{-1}< (N|Q|)^{-1}\). Let us consider each \(A/Q\in\mathcal{G}_N\) as the center of a circle of radius \(r(N|Q|)^{-1}\). Then we can assure that they do not overlap when \(r\le 1/2\).

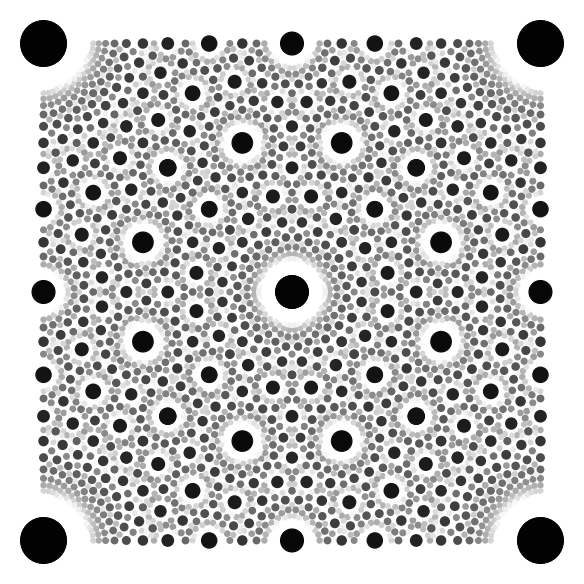
This is corresponding figure for \(N=120\) and \(r=1/2\):

fare120_1d2_gray
\(\text{cmap}=\texttt{gray},\)    \(N=120,\)    \(r=1/2\)

In the caption, \(\text{cmap}=\texttt{gray}\) indicates that we are using the colormap gray assigning to the radius values colors that go from black to white. So, smaller norms of the denominators give bigger darker circles.

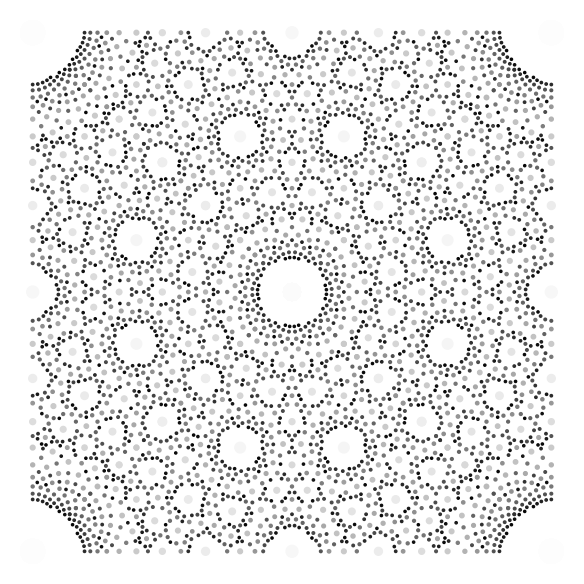
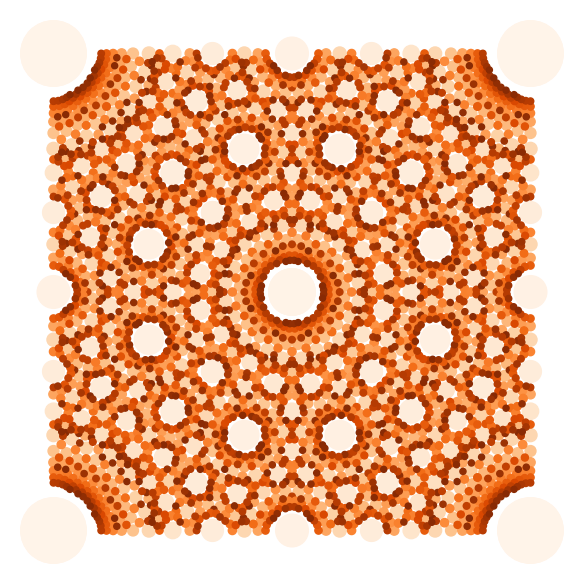
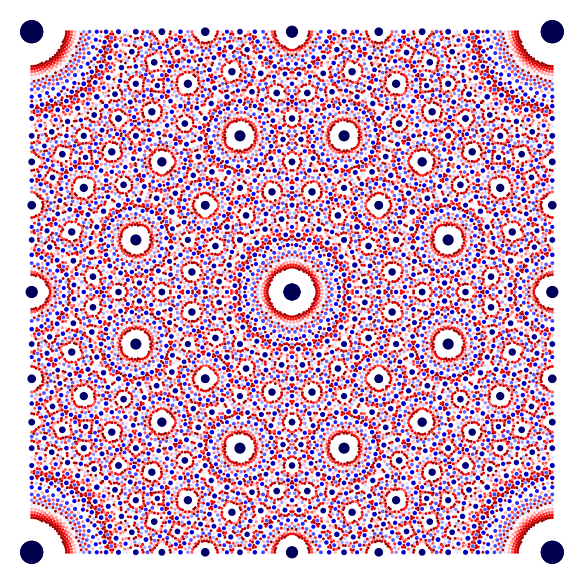
These are other examples. In the first figure the colormap is complementary to gray and \(r\) has been taken smaller, hence the circles seem more sparse. In the second figure, \(r\) has exceeded the limit value \(1/2\) and some of the circles overlap.

fare120_1d4_binary   fare120_3d4_Oranges
\(\text{cmap}=\texttt{binary},\)    \(N=120,\)    \(r=1/4\) \(\text{cmap}=\texttt{Oranges},\)    \(N=120,\)    \(r=3/4\)

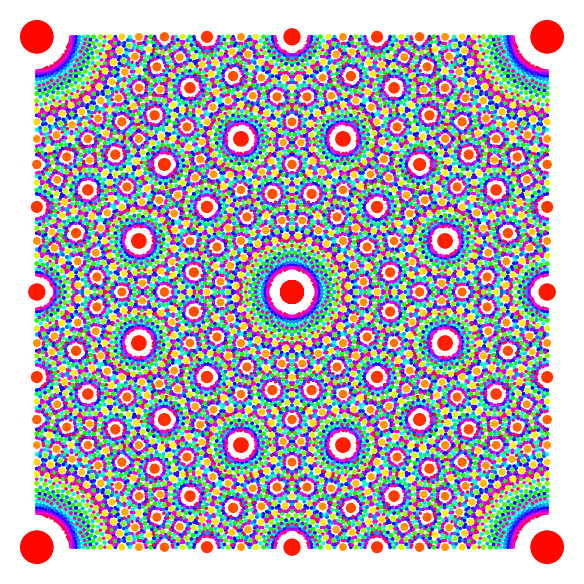
The standard colormaps have 256 values indexed from 0 to 255. So, \(N\) around 255 is a kind of limit if we want to distinguish with different colors all the different radii (the truth is more complicated because the radii do not vary linearly). These are two colorfull examples with \(N=255\).

fare255_1d2_hsv   fare255_1d3_seismic
\(\text{cmap}=\texttt{hsv},\)    \(N=255,\)    \(r=1/2\) \(\text{cmap}=\texttt{seismic},\)    \(N=255,\)    \(r=1/3\)


The code

This is the SAGE code that produces all the images:
from sage.plot.colors import get_cmap
K.<s> = ZZ[I] # s is the imaginary unit

def gfar(N):
  """
  List of Farey triples (q, x, y): x+iy is the fraction
  and q the (squared) norm of the denominator
  N = max norm of the denominator
  """

  LG = [ (a,b) for b in srange(sqrt(N)) for a in srange(b+1) if a^2+b^2<N]
  Lres = []

  print 'There are ',len(LG),' pairs'

  for l in range(len(LG)):
    for k in range(l+1):
      a, b, c, d = LG[k][0], LG[k][1], LG[l][0], LG[l][1]
      if gcd(K(a+b*s),K(c+d*s)).norm()==1:
  #      print a,',',b,'-->',c,',',d
        q = c^2+d^2
        xx = abs((a*c+b*d)/q)
        yy = abs((b*c-a*d)/q)
        if xx+yy<=1:
          if xx>yy: xx, yy = yy, xx
          Lres.append( (q,xx,yy) )
        
      if gcd(K(a-b*s),K(c+d*s)).norm()==1 and a*c*(a-b)*(c-d)!=0:
        # the 2nd condition is to avoid repetitions
  #      print a,',',-b,'-->',c,',',d
        q = c^2+d^2
        xx = abs((a*c-b*d)/q)
        yy = abs((-b*c-a*d)/q)
        if xx+yy<=1:
          if xx>yy: xx, yy = yy, xx
          Lres.append( (q,xx,yy) )
        

  print 'There are ',len(Lres),' points'
  return Lres

def pgfar(N,Lcmr):
  """
  Plot Gaussian Farey fractions (in Lres) using the colormap and radius in Lcmr
  """
  Lres = gfar(N)[:]
  for itc in Lcmr:
    cmname, r = itc[0], itc[1] # cmname = name of the color map, r = constant for the radius
    cm = get_cmap(cmname)
    P = point([(0,0)], size=0)
    L = []
    for item in Lres:
      mL = [(item[1],item[2]), (1-item[2],1-item[1]), (item[2],item[1]), (1-item[1],1-item[2])]
      for po in mL:
        P += circle(po,r/sqrt(item[0]*N), color=cm(floor(item[0]*255/N))[:3], fill=True)
    eps = r/sqrt(N)
    P.axes(False)
    P.set_axes_range(-eps, 1+eps, -eps, 1+eps)
    P.set_aspect_ratio(1)
    fname = 'fare'+str(N)+'_'+str(r)+'_'+cmname+'.png'
    fname = './' +fname.replace('/','d')
    print fname
    P.save(fname)


#pgfar(100,[('jet',1/3), ('Oranges',1/3), ('Set1',1/3), ('Reds_r',1/3), ('autumn',1/3), ('binary_r',1/3), ('copper',1/3), ('hsv',1/3), ('seismic',1/3), ('winter',1/3), ('summer',1/3), ('spring',1/3), ('hot',1/3), ('Accent',1/3)])

# Gray max r = 1/2, Binary, Oranges r = 1/3, 2/3
pgfar(120,[('gray',1/2), ('binary',1/4), ('Oranges',3/4)])

# Fancy colors, maximal height of the denominator
pgfar(255,[('hsv',1/2), ('seismic',1/3)])