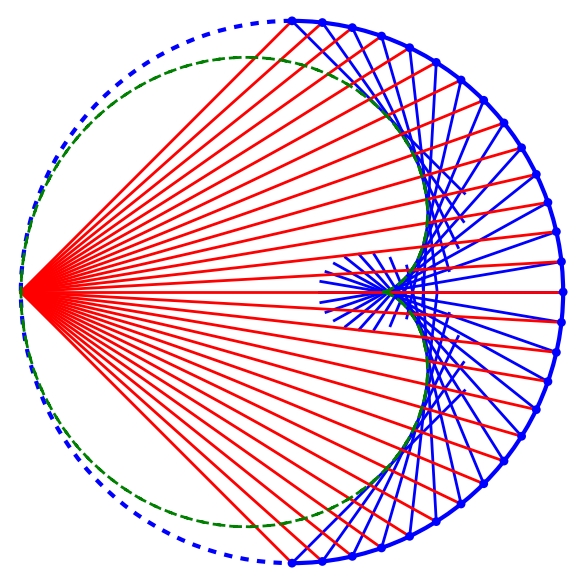
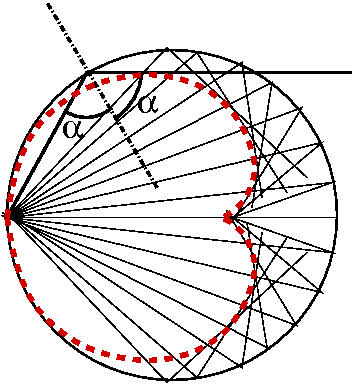
N = 28
The code below plots the cardioid and the nephroid as the envelope of a pencil of lines and shows how this pencil corresponds to reflected rays.
The parameter N, when it is a multiple of 4, means the number of points minus one.
| |
Cardiod N = 28
|
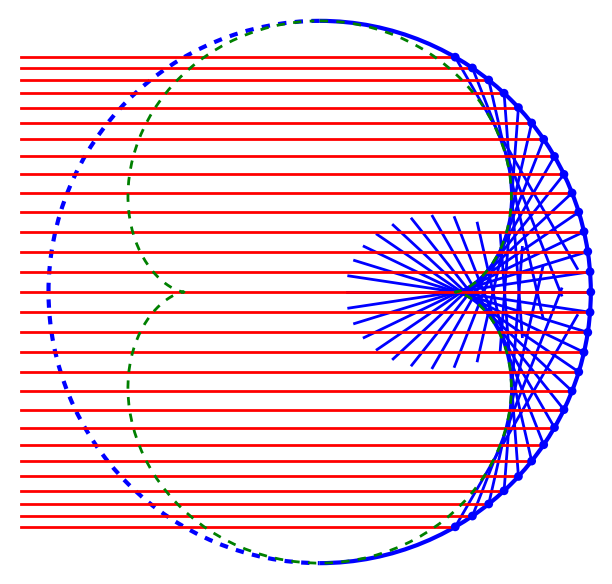 |
Nephroid N = 28
|
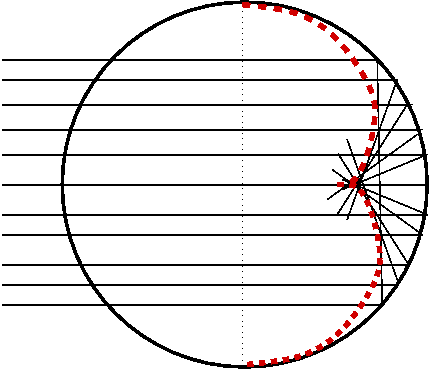
Increasing N to N = 48 we get:
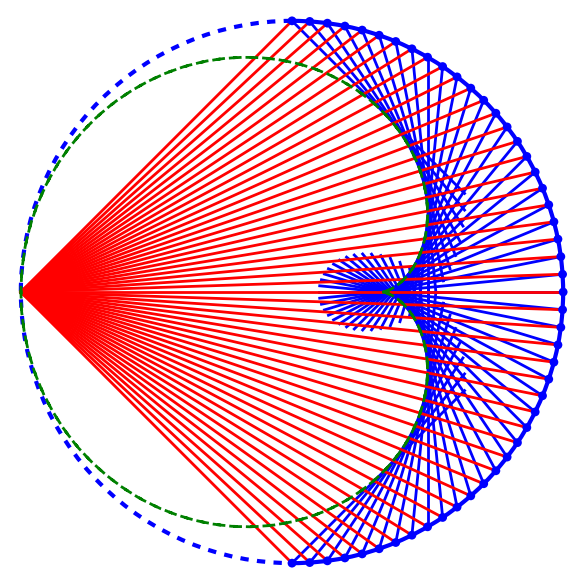 |
Cardiod N = 48
|
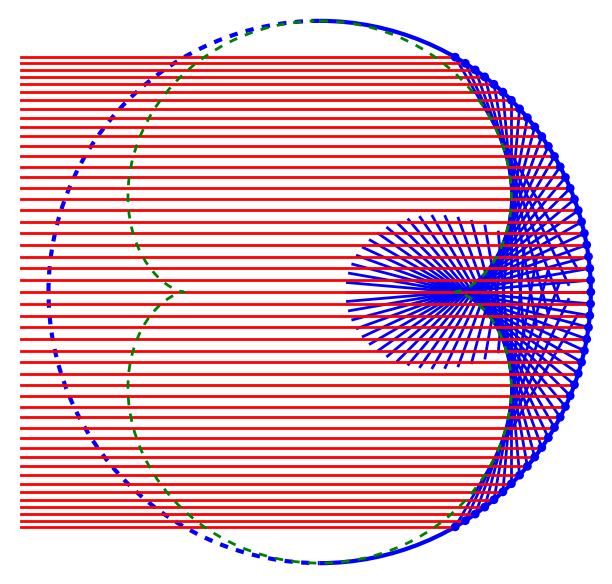 |
Nephroid N = 48
|
This was an early version plotted by hand long time ago with Xfig. Yes, it is not a good idea.
 |
 |
This is SAGE code producing the plots of the carioid:
N = 28


# Forces N even

N = 2*round(N/2)


def nephr():

  L = [( sin(t)*sin(3*t)+1/3*cos(t)*cos(3*t),-sin(t)*cos(3*t)+1/3*cos(t)*sin(3*t)) for t in srange(0,2*pi,0.03)]

  P = list_plot(L, plotjoined=True, color='green', thickness=2, zorder=120, linestyle='--')

  return P


def pcir(k):

  k -= N

  return ( cos(pi*k/N).n(), sin(pi*k/N).n() )


def rline(k):

  # Reflected line of length l = 0.9

  l = 0.9

  v = vector(pcir(2*k)) - vector(pcir(k))

  v = l*v/v.norm() + vector(pcir(k))

  return line([pcir(k), v], thickness=2)


P = arc((0,0),1,1,0,(pi/2,3*pi/2), linestyle='--', thickness=3)

P += arc((0,0),1,1,0,(-pi/2,pi/2), thickness=3)

P += nephr()


for k in srange(N/2, 3*N/2+1):

  P += line([(-1.0,0), pcir(k)], thickness=2, color='red', zorder=100)

  P += rline(k) + point([pcir(k)], size=40, zorder=110)


P.set_aspect_ratio(1)

P.axes(False)


P.save('cardiod_'+str(N)+'.png')
The analogue SAGE code for the nephroid is:
N = 28


# Forces N to be a multiple of 4

N = 4*round(N/4)


def nephr():

  L = [((3*sin(t)+sin(3*t))/4,(3*cos(t)+cos(3*t))/4) for t in srange(0,2*pi,0.03)]

  P = list_plot(L, plotjoined=True, color='green', thickness=2, zorder=120, linestyle='--')

  return P


def pcir(k):

  k -= 3*N/4

  return ( cos(2*pi*k/N/3).n(), sin(2*pi*k/N/3).n() )


def rline(k):

  # Reflected line of length l = 0.9

  l = 0.9

  v = vector(pcir(3*k)) - vector(pcir(k))

  v = l*v/v.norm() + vector(pcir(k))

  return line([pcir(k), v], thickness=2)


P = arc((0,0),1,1,0,(pi/2,3*pi/2), linestyle='--', thickness=3)

P += arc((0,0),1,1,0,(-pi/2,pi/2), thickness=3)

P += nephr()


for k in srange(N/4, 5*N/4+1):

  P += line([(-1.1,pcir(k)[1]), pcir(k)], thickness=2, color='red', zorder=100)

  P += rline(k) + point([pcir(k)], size=40, zorder=110)


P.set_aspect_ratio(1)

P.axes(False)


P.save('nephroid_'+str(N)+'.png')