With a simple Matlab/Octave program one can transform
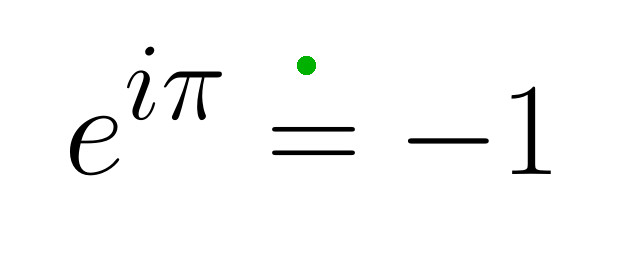
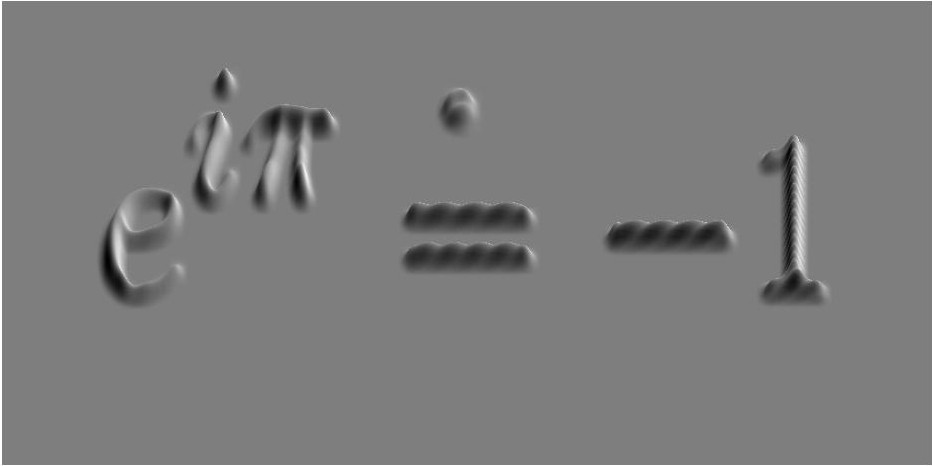
or any other image, into
The code
In Octave you have to type first pkg load image and the syntax for axis seems to be a little bit different.
In few words, one consider a gray version of the original image and the
associated function with white=0, black=1. A convolution is applied on
this function and the result is multiplied by an oscillatory function
to produce ripples. Finally the graph of the function is plotted with a
view that is rather vertical.
The commented color maps are to play with them. The rest of the standard color maps give ugly results in general.
imag = imread('form1.jpg');

imag = rgb2gray(imag);

imag = 1-im2double(imag);


% SMOOTHING

b = 6;

%%%%%%%%%%%

% HEIGHT (inverse)

h = 10;

%%%%%%%%%%%

% ELEVATION (degrees)

el = 60;

%%%%%%%%%%%

A = imag;


C = conv(ones(b,1),ones(b,1));

C = C*C'/sum(sum(C*C'));

A = conv2(A, C,'same');


[X, Y] = meshgrid ( linspace (0, 1, size(A,2)), linspace (0, 1,
size(A,1)));

A = A.*(1+0.1*sin( 400*(X.*Y)));

%A = A.*(1+0.1*sin( 400*(X)));


A = fliplr(A);

[Fx,Fy] = gradient (A);


figure(1)

clf;

%colormap(copper(100));

%colormap(bone(64));

%colormap(summer(200));

%colormap(ocean(200));

colormap(gray(80));

%colormap(hot(40));

%colormap(pink(32));

%colormap(winter(80));


surf(A, Fx+Fy)

shading interp;

view([180 el]);

axis ([0 size(A,2) 0 size(A,1) 0,h]);

axis off


%print -deps form1r.eps
%saveas (1, 'form1r.jpg');