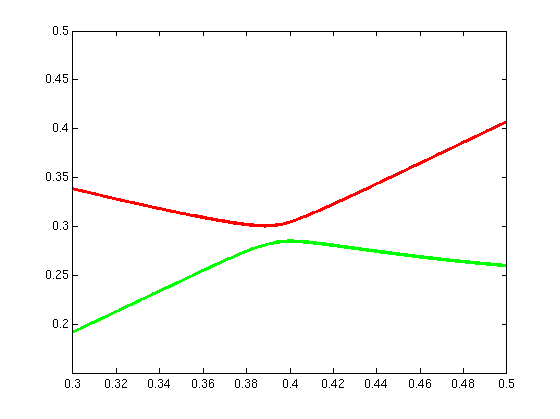
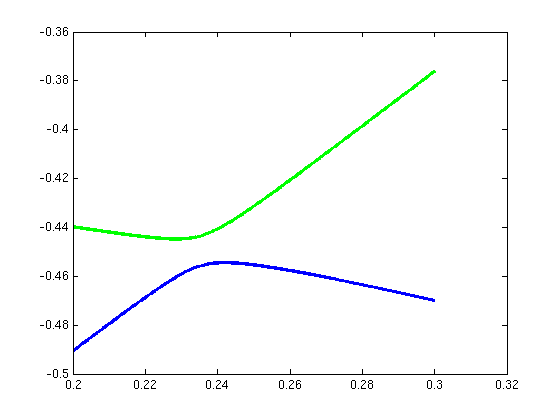
| 1 |
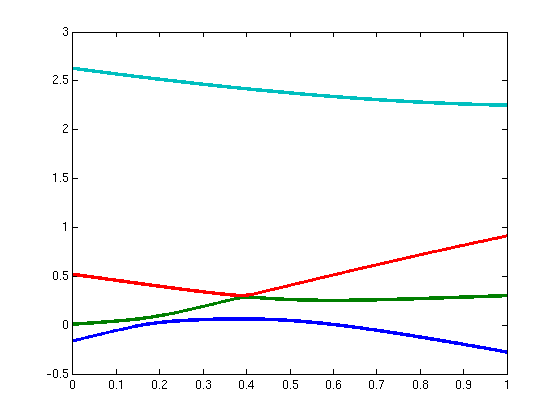 |
A = [0.9912 0.2037
0.8272
0.6759; 0.2037 0.4758 0.3991 0.5994; 0.8272 0.3991 0.8214 0.8411;
0.6759 0.5994 0.8411 0.7008] |
|
B = [0.7425 0.7579
0.3891
0.4293; 0.7579 0.5730 0.8497 0.2763; 0.3891 0.8497 0.9635 0.0859;
0.4293 0.2763 0.0859 0.9047] |
| 2 |
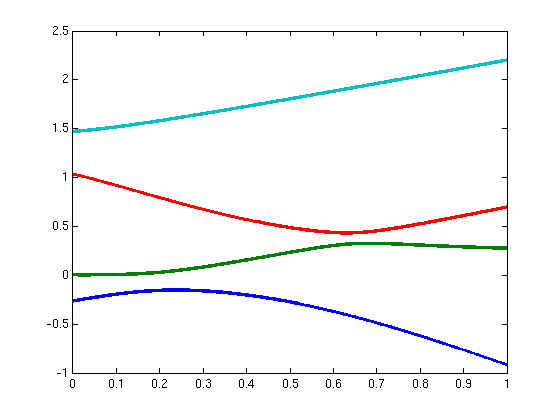 |
A = [0.4519 0.3334
0.0591 0.7409; 0.3334 0.1999 0.4272 0.1687; 0.0591 0.4272 0.9418
0.0172; 0.7409 0.1687 0.0172 0.6505] |
|
B = [0.7266 0.0945
0.8776 0.0144; 0.0945 0.1799 0.9263 0.0682; 0.8776 0.9263 0.6513
0.8646; 0.0144 0.0682 0.8646 0.6944] |
| 3 |
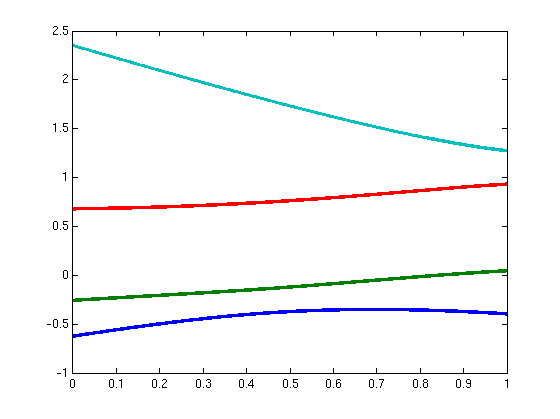 |
A
= [0.9158 0.1355 0.3321 0.8975; 0.1355 0.6153 0.5831 0.6983; 0.3321
0.5831 0.0321 0.8271; 0.8975 0.6983 0.8271 0.5815] |
|
B = [0.9377 0.0478
0.0540 0.0206; 0.0478 0.5986 0.1140 0.7962; 0.0540 0.1140 0.0693
0.1360; 0.0206 0.7962 0.1360 0.2436] |
| 4 |
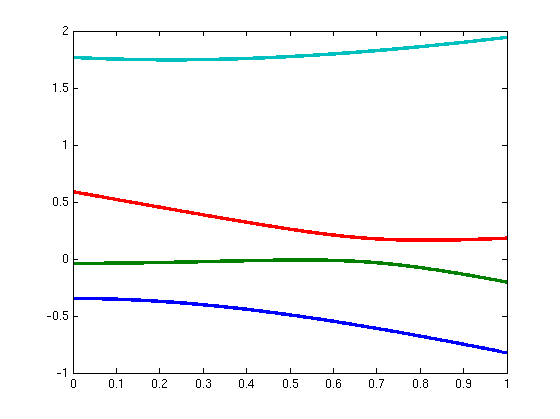 |
A = [0.0686 0.2994
0.5916 0.2033; 0.2994 0.7984 0.5017 0.6508; 0.5916 0.5017 0.6008
0.1125; 0.2033 0.6508 0.1125 0.4982] |
|
B = [0.2776 0.6525
0.9173 0.5098; 0.6525 0.1973 0.1112 0.2974; 0.9173 0.1112 0.3115
0.6938; 0.5098 0.2974 0.6938 0.3065] |
| 5 |
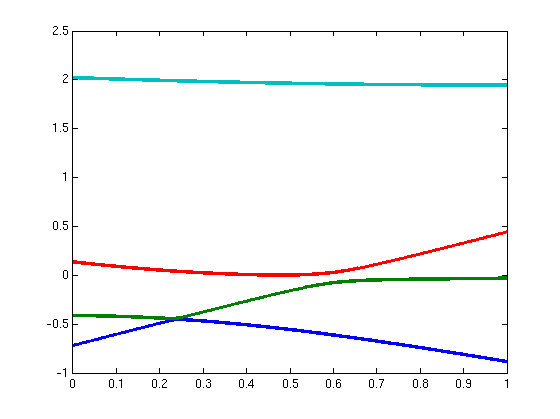 |
A = [0.1056 0.5938
0.2827 0.1552; 0.5938 0.2836 0.5508 0.8709; 0.2827 0.5508 0.1310
0.8337; 0.1552 0.8709 0.8337 0.5047] |
|
B = [0.4050 0.1736
0.5752 0.6062; 0.1736 0.5199 0.9892 0.4899; 0.5752 0.9892 0.0348
0.2928; 0.6062 0.4899 0.2928 0.5111] |
| 6 |
 |
A = [0.3668 0.7395
0.5247 0.8045; 0.7395 0.1895 0.1237 0.8210; 0.5247 0.1237 0.8960
0.5154; 0.8045 0.8210 0.5154 0.8553] |
|
B = [0.3829 0.0846
0.7339 0.3320; 0.0846 0.3717 0.8282 0.1765; 0.7339 0.8282 0.0441
0.6867; 0.3320 0.1765 0.6867 0.9797] |
